How to create reports using Insights

Unlock the full potential of your data with powerful, intuitive reporting tools. Effortlessly manage and build advanced reports using dynamic pivot tables, interactive charts, and flexible data sources. Whether you’re uncovering trends, tracking performance, or presenting insights, with this module you can turn complex information into clear and compelling visuals. In this guide, we’ll focus on using pivot tables to create valuable, actionable reports that transform raw data into meaningful insights.

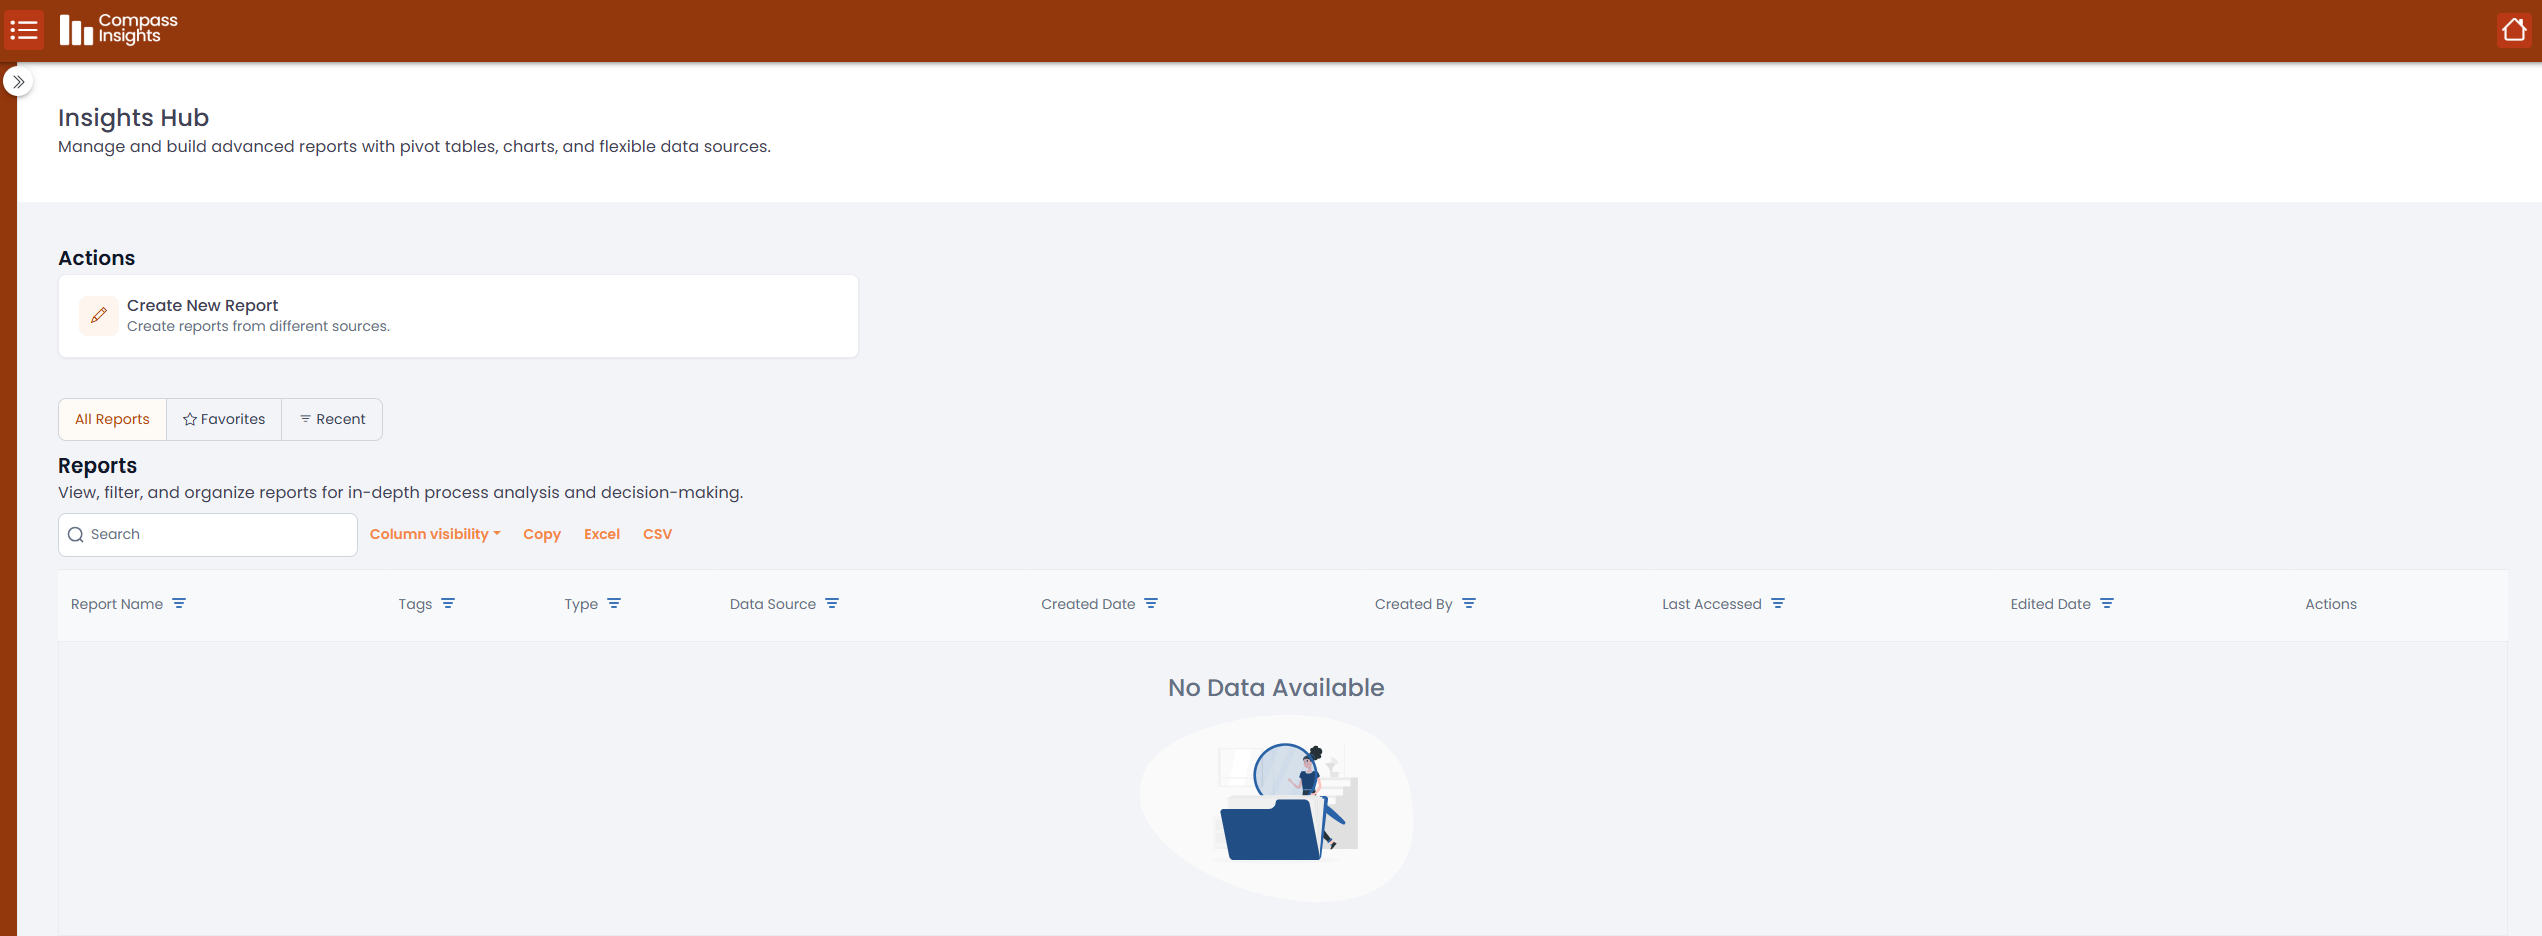
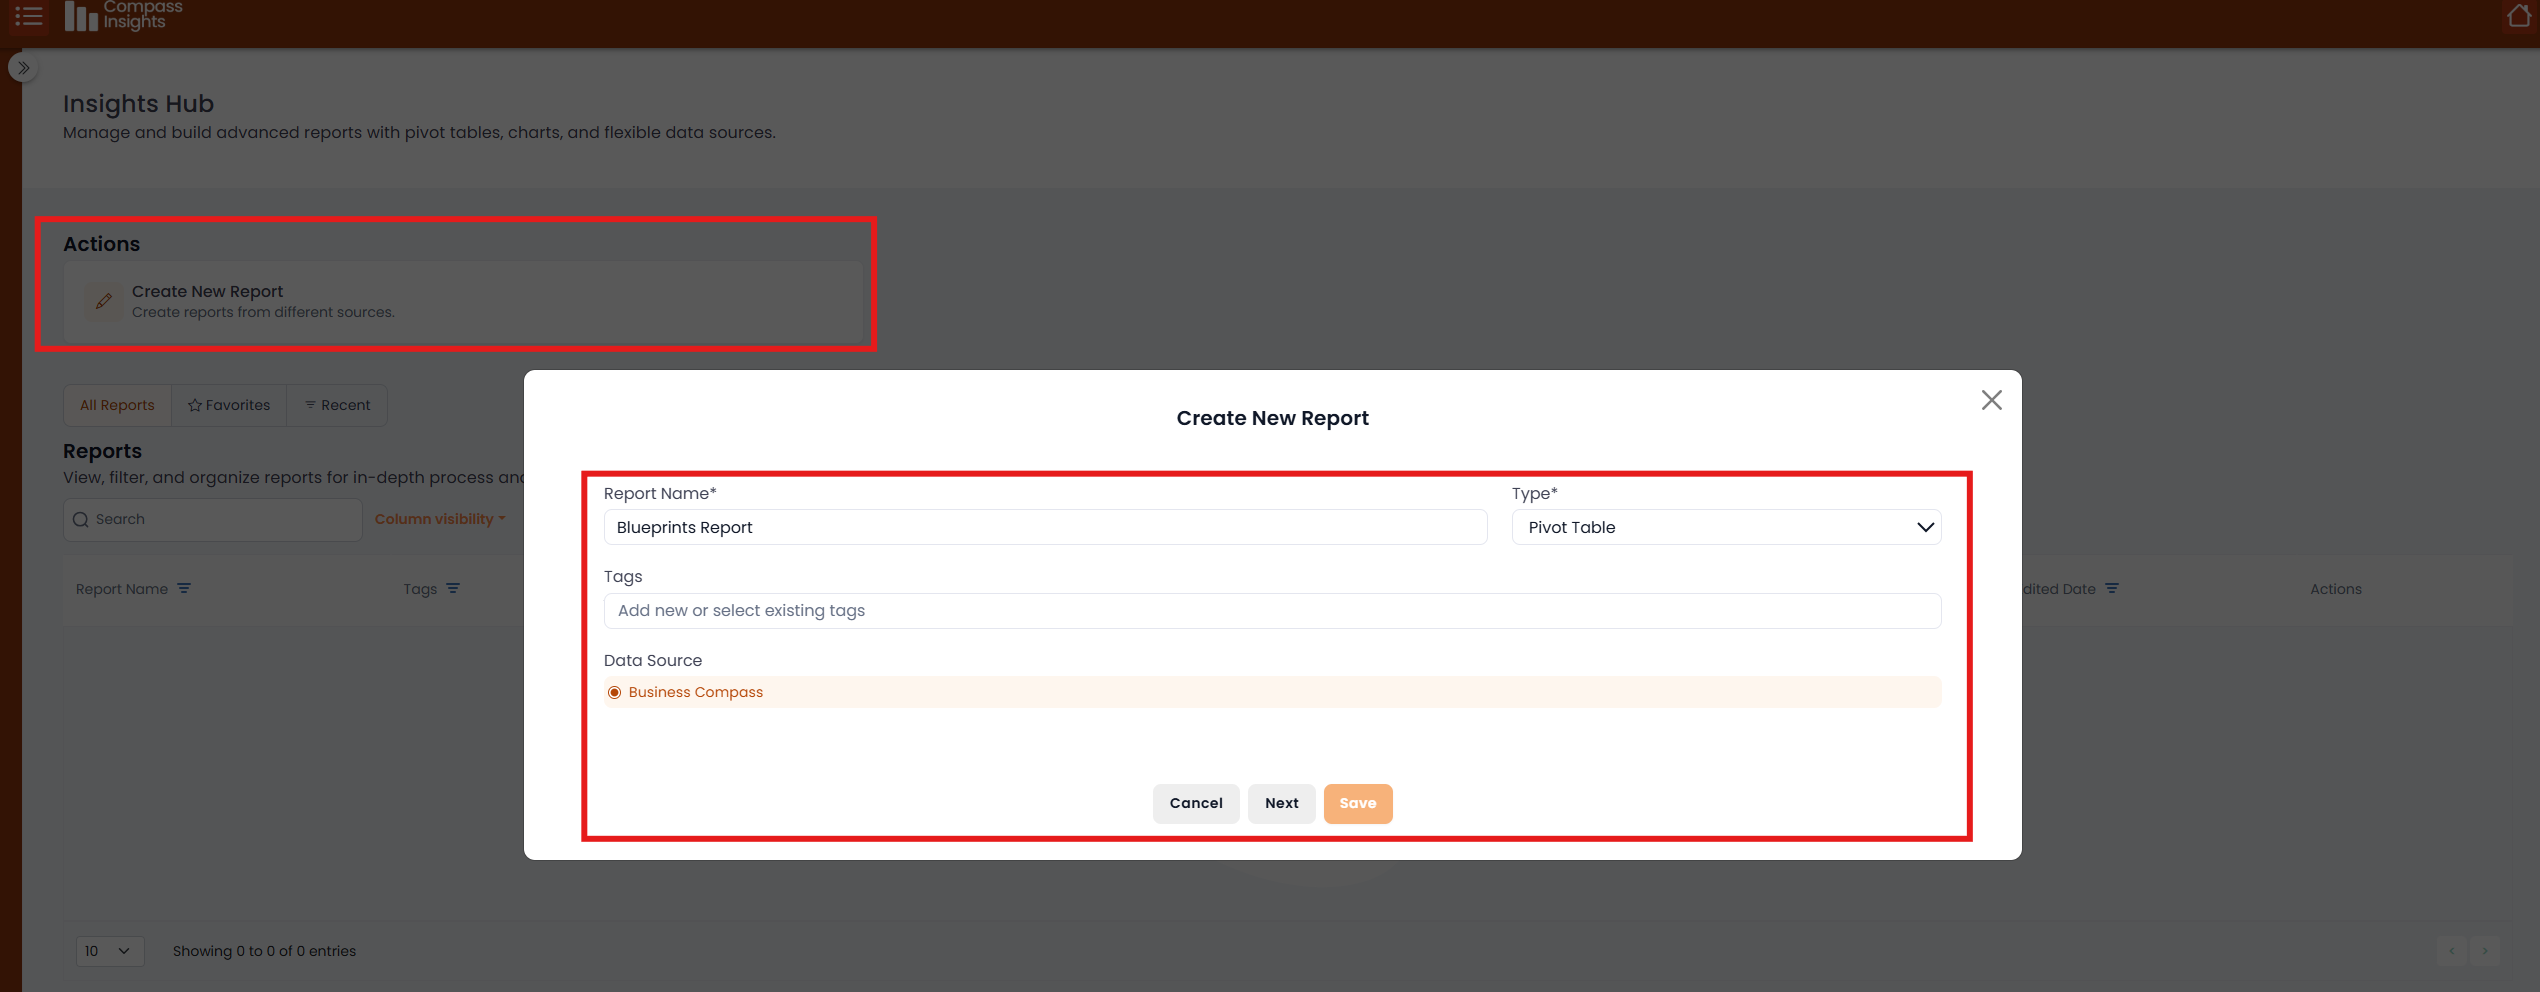
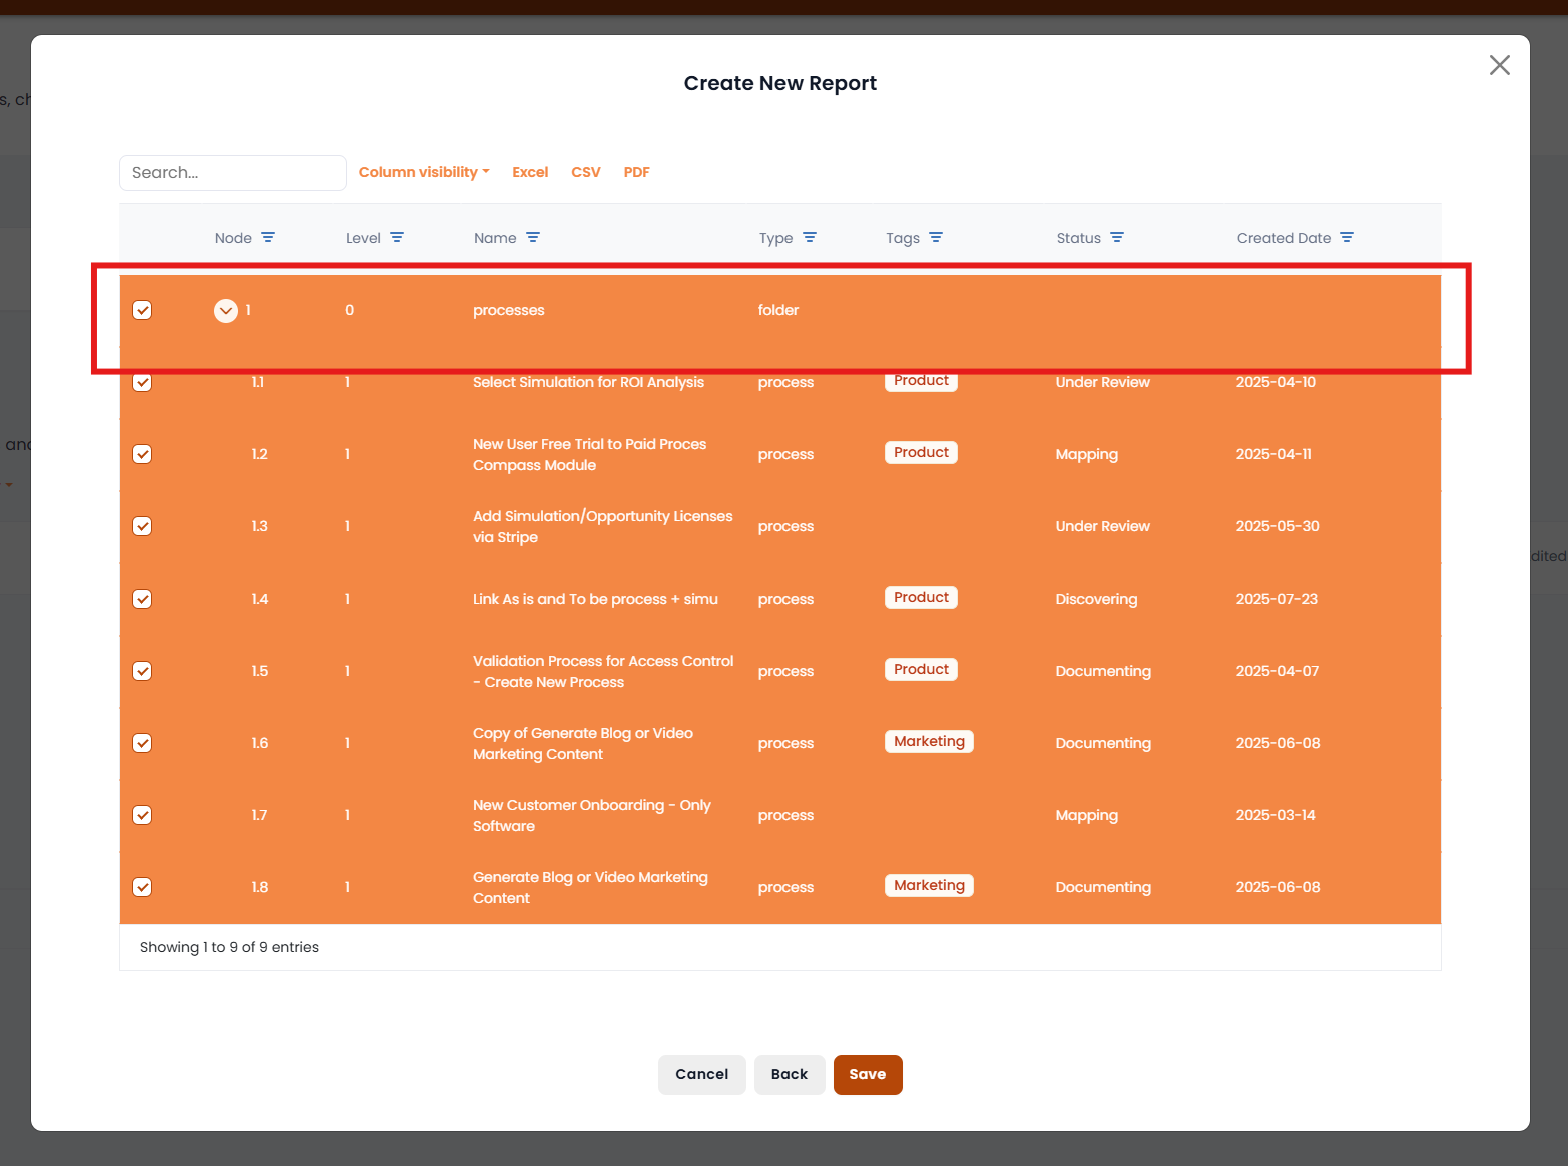
Part 1—Access & Select Your Data

Before you can build a pivot table, you need the right starting point.

  • Name your report with a clear, descriptive title.
  • Create your pivot table using your chosen dataset.
  • Use tags as filters to show only processes related to a specific tag.
  • Select processes to include:Pick specific processes using tags, or Select the folder containing all processes if you want to include everything. Example: If you want to create a table of HR processes, assign the HR tag to them so only those will appear.
Access the insights Hub.
Create a new report.
Select Processes you want to include

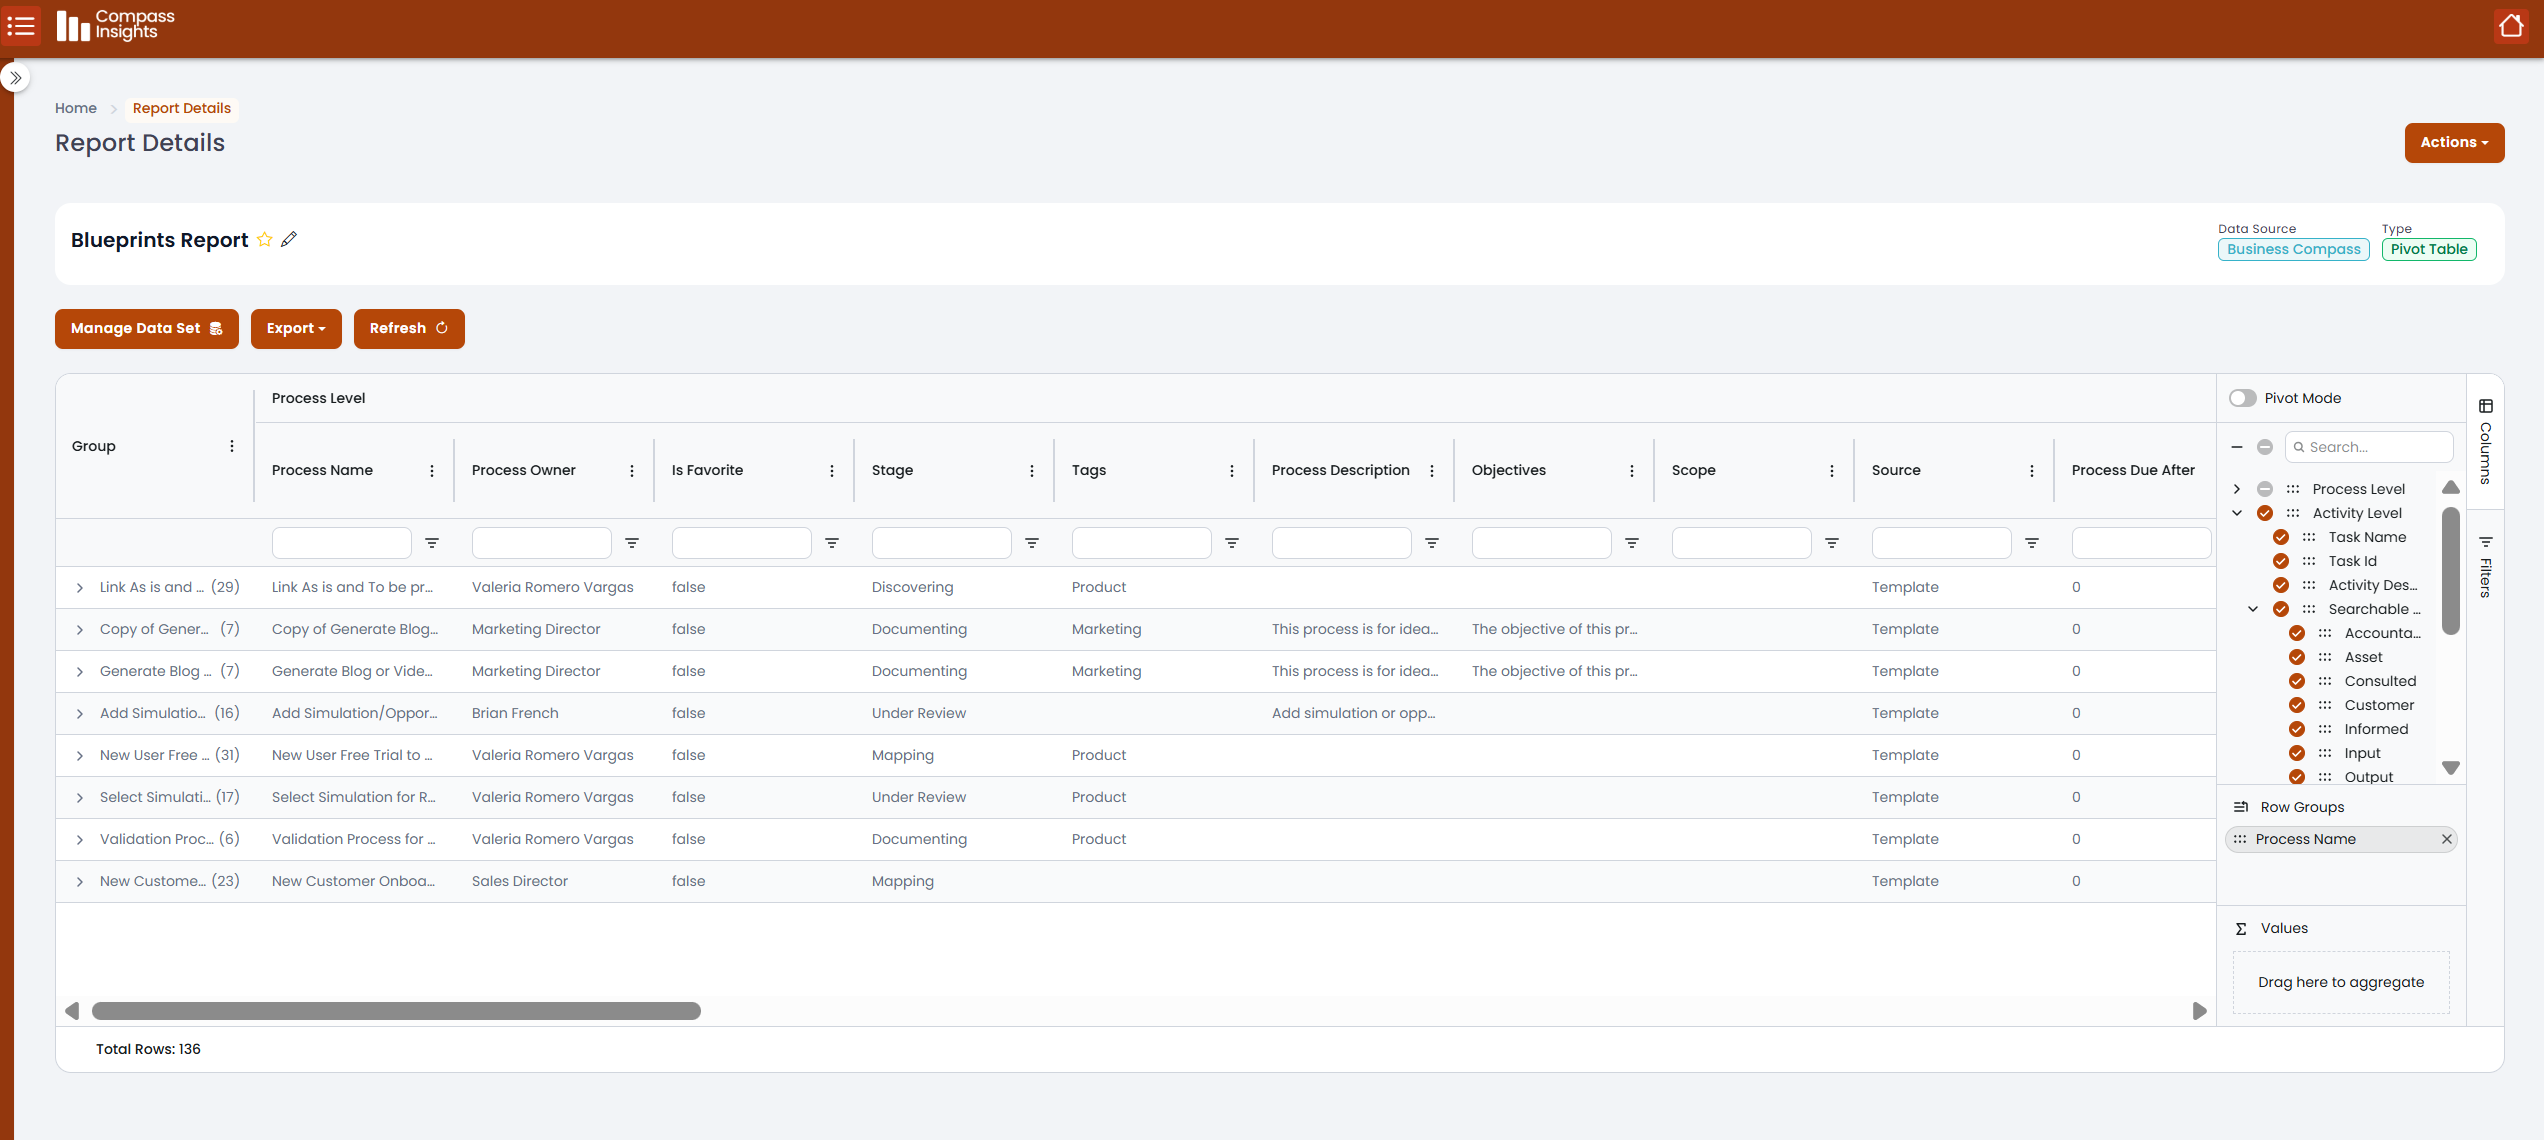
Part 2—Build your pivot table structure

This is where raw data transforms into an organized, insightful view.

  • Drag fields into rows and columns to set your layout.
  • Drop fields into Values to calculate sums, averages, counts, or percentages.
  • Group related values (e.g. process, systems).
Add columns and rows that you want to include in your report

Stop Guessing.
Start Knowing.

Every day you wait is another day that six-figure savings stay hidden in your processes. Take the first step.